
Nextoar
Solutions

Nextoar Zone AI

Ask any plant what its biggest loss is and you will hear unplanned downtime. Ask what causes it and you will get a downtime code, a shift note and an opinion. The stoppage gets recorded, rarely explained, and it comes back next month.

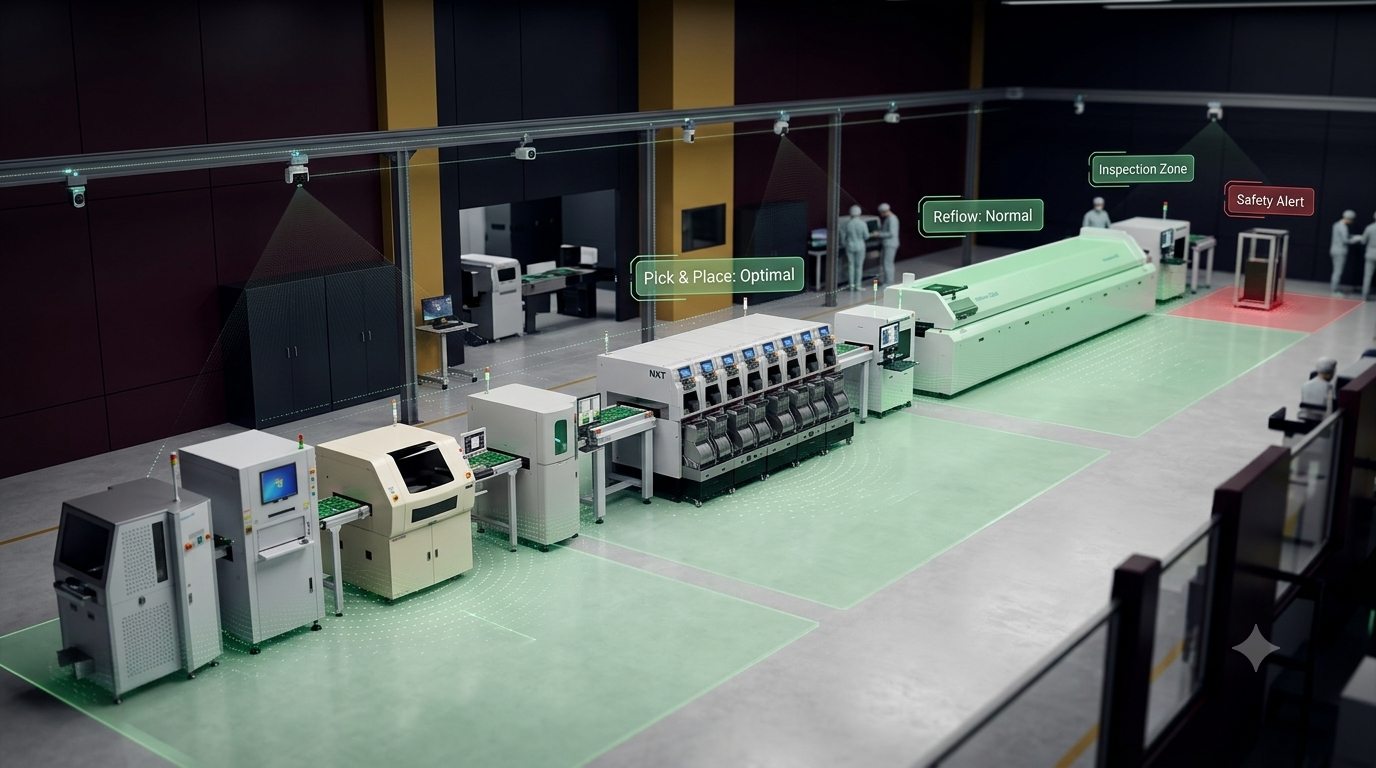
Nextoar Zone AI watches every zone continuously, captures the chain of events that led to each stoppage, and turns that record into a list of causes you can remove one at a time. Downtime stops being a number you report and becomes a backlog you work through.

See the features

Key features

  1. Every Stoppage Captured, With Its Context

    Zone AI starts by mapping your space into meaningful zones and defining the events that matter inside each one. Machine open, stencil clean, operator intervention, unit arrival, dwell overrun, restricted area entry, container out of footprint. The taxonomy is built for your operation rather than borrowed from a generic model library, which is why the event log reads like something your supervisors recognise and trust. Because it runs continuously, it catches the micro stoppages that never make it into a downtime code and quietly cost more than the failures that do.

  2. Trace the Event Chain Behind the Downtime

    A machine stopping is the last event in a sequence, not the first. Zone AI reconstructs the minutes before every stoppage: the material that arrived late, the operator who was pulled to another cell, the changeover that started without the kit, the intervention that happened three times before the failure. You get the causal chain with the visual evidence attached, instead of a code that says “waiting for material” and a supervisor's best recollection at the end of the shift. Arguments about what actually happened end, because the record is not anybody's memory.

  3. Eliminate Systematically, Then Prove It Stayed Eliminated

    One traced stoppage is an anecdote. Many of them, classified consistently, are a work list. Zone AI ranks recurring causes by the downtime and throughput they actually cost, so improvement effort goes where the loss is rather than where the last escalation was. Once a countermeasure is in, the same event stream verifies it: the cause either disappears from the data or it does not, and recurrence is flagged the moment it creeps back. This is what turns downtime reduction from a quarterly firefight into a loop that keeps closing.

  4. Safety Critical Area Monitoring

    Safety monitoring today is manual, sampled and retrospective. Zone AI watches continuously across mixed traffic aisles, restricted zones, confined space entries, dock edges and high risk work areas, detecting proximity, exclusion breaches, missing protective equipment and unsafe practice as they happen. The lasting value is not the alert. It is the near miss record and behaviour pattern data no tag based system produces, which is what lets a safety team change a layout or a policy with evidence behind it.

  5. Asset, Material and WIP Visibility Without Touching the MES

    Zone AI reads unit arrival and departure per station, station state as running, idle, blocked or starved, rack and bin level removal and replenishment, and chain of custody for controlled items. Blocked and starved states matter most here, because they locate the constraint that is actually costing you output rather than the machine that happens to be stopped. All of it comes from vision, so live work in progress visibility arrives without instrumenting machines or integrating into systems you do not own. In airgapped and legacy environments, that is often the only way the data exists at all.

  6. Ask the Floor a Question

    An event log nobody queries is an archive. Zone AI answers plain language questions about what happened in a zone across a shift or a week, with the visual evidence attached to the answer. Ask why line three lost four hours last Tuesday and you get the sequence, not a spreadsheet to interpret. Shift summaries and exception reports generate themselves and reach the right people on the channels they already watch. The supervisor stops writing the report and starts acting on it.

  7. Built to Scale, Deployed at the Edge

    The architecture is designed for thousands of camera and drone feeds across plants, warehouses, utilities and remote sites, processed on edge hardware inside your boundary. Video does not leave the facility, bandwidth is not the constraint, and adding a zone is a configuration exercise rather than a new project.

Ready to transform your operations?

Book a personalized demo with our team and see Nextoar in action.